La bourse est fermée
Dow Jones
38 911,68 -157,91 (-0,40 %) Nasdaq
17 012,60 +91,80 (+0,54 %) Nikkei 225
38 855,37 -44,65 (-0,11 %) EUR/USD
1,0878 +0,0018 (+0,16 %) HANG SENG
18 821,16 -6,19 (-0,03 %) Bitcoin EUR
62 294,91 -2 316,59 (-3,59 %)
Principal Real Estate Securities Fund (PFRSX)
Nasdaq - Nasdaq Prix différé. Devise en USD
Ajouter à la liste dynamique
À partir de 08:05AM EDT. Marché ouvert.
Principal Real Estate Securities Fund
Des Moines, IA 50392
711 High Street
Principal Financial Group
(800) 986-3343
Informations de gestion
Kelly D. Rush,Chef de file depuis 5 décembre 2000
Kelly D. Rush, CFA - CEO, Public Real Assets & CIO, Real Estate Securities As CEO Of Public Real Assets, Kelly provides executive level leadership of Principal Asset Management’s listed real assets strategies including both real estate securities and listed infrastructure. As CIO of Real Estate Securities, he is further responsible for directing the daily activities of the listed real estate securities unit. Kelly founded Principal’s listed U.S. equity real estate securities business in 1998. Under his leadership, the business expanded into managing global strategies in 2007 and the firm is widely recognized as an industry leader in managing listed real estate equity securities. In 2019, Kelly played a leading role in the firm’s launch of a listed infrastructure strategy by successfully advocating for the development of the strategy and the hiring of the lead portfolio manager. Kelly joined the firm in 1987 as a member of Principal Financial Group’s real estate investment division. As a private market investment professional, he was responsible for generating commercial mortgage loan investments. In the mid-1990s his focus shifted to structuring commercial mortgage loans for public real estate companies and analyzing bonds issued by the same. Kelly received his MBA in business administration and a bachelor’s degree in finance from the University of Iowa. He has earned the right to use the Chartered Financial Analyst designation and is a member of both the Iowa Society of Financial Analysts and the CFA Institute.
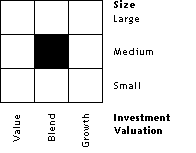
Style box Morningstar
Yahoo collabore avec Morningstar, l’un des principaux groupes de données sur les investissements, la bourse et les marchés, pour permettre aux investisseurs de noter et de comparer les différents fonds sur Yahoo Finance. La catégorie Morningstar s’affiche à côté de la style box Morningstar, qui identifie les objectifs de placement en fonction des titres sous-jacents du fonds.

Catégorie Morningstar
Tandis que l’objectif de placement énoncé dans la brochure d’un fonds peut refléter ou non la manière dont investit réellement le fonds, la catégorie Morningstar est attribuée en fonction des titres sous-jacents de chaque portefeuille. Les catégories Morningstar permettent aux investisseurs et aux spécialistes en placement d’effectuer des comparaisons pertinentes entre les différents fonds. Ces catégories facilitent la constitution de portefeuilles largement diversifiés, l’évaluation des risques potentiels et l’identification des fonds offrant les meilleures performances. Nous plaçons les fonds dans une catégorie donnée en fonction des statistiques et des compositions de ses portefeuilles au cours des trois dernières années. S’il s’agit d’un nouveau fonds qui n’a aucun historique de portefeuilles, nous estimons la catégorie à laquelle il appartiendra avant de lui attribuer une catégorie de façon plus permanente. Lorsque cela est nécessaire, nous pouvons modifier la catégorie attribuée à un fonds en fonction des récents changements apportés au portefeuille.
Présentation du fonds
CatégorieReal Estate
Famille de fondsPrincipal Funds
Actifs nets5,49B
Rendement sur un an-9,18 %
Rendement3,08 %
Évaluation Morningstar★★★★
Date de création5 déc. 2000
Opérations du fonds
Dernier dividende0,16
Dernier gain en capital1,00
Chiffre d’affaires d’exploitation16,10 %
Moyenne pour la catégorieS.O.
Frais et coût d’exploitation
Coût d’exploitationPFRSXMoyenne de la catégorie
Rapport annuel du TER (net)0,81 %1,08 %
Prévision des coûts (net)0,81 %S.O.
Prévision des coûts (brut)0,81 %S.O.
Commission max 12b1S.O.S.O.
Commission d’entrée maximaleS.O.5,10 %
Commission max ventes à termeS.O.1,13 %
Projection du coût d’exploitation sur 3 ans0S.O.
Projection du coût d’exploitation sur 5 ans0S.O.
Projection coût d’expl. sur 10 ans0S.O.